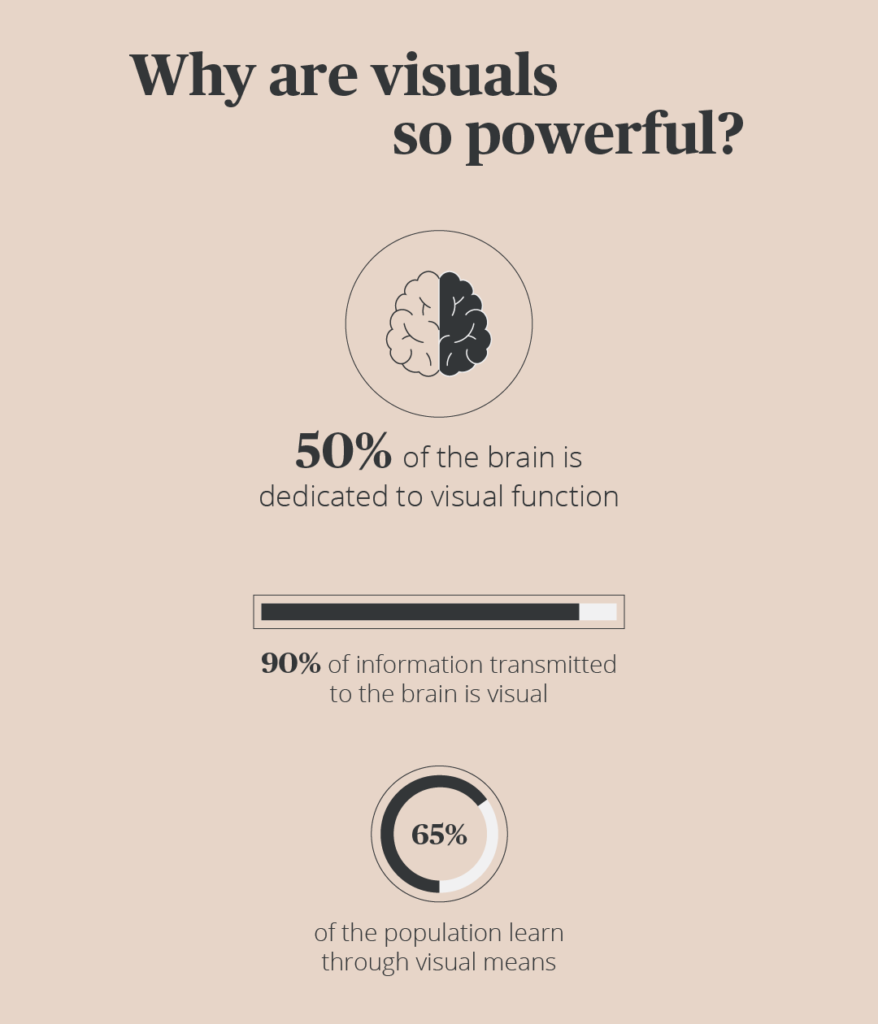
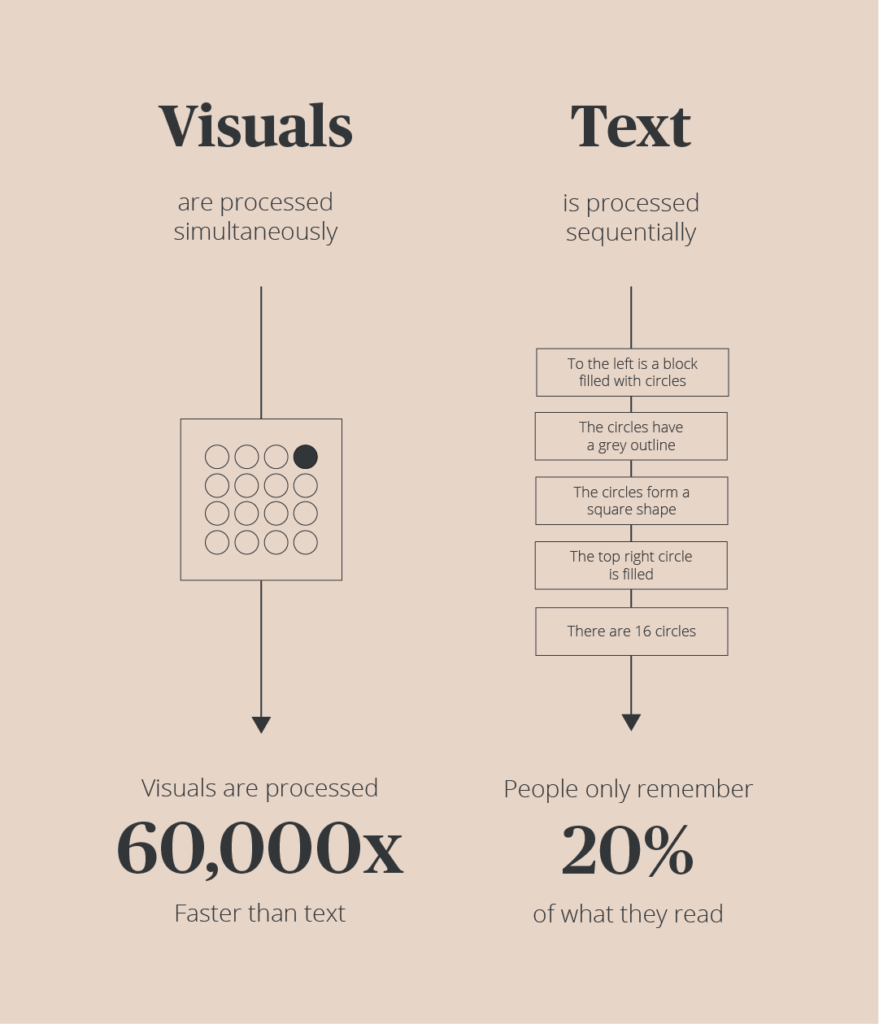
In an industry where its cornerstone is insight – clarity, ease of understanding and engagement of data are key. The use of visual data is one of the best ways to achieve these.
Data to Visuals
Below you can see a typical data table. It contains all the results for one question.

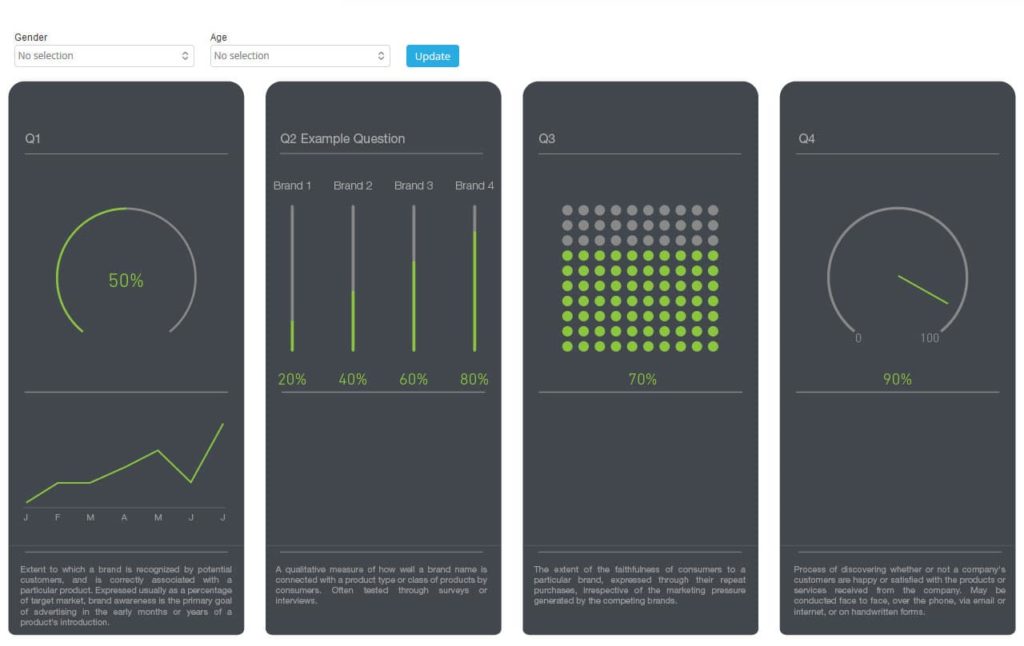
Putting this same data into a dashboard allows a vastly different view, with you immediately being able to understand the story your data is telling, as well as being able to filter your data in various ways.
Why use dashboards?
Some of the major benefits of utilizing dashboards are:
- Understanding large amounts of complex data quickly and easily
- Easily identifying trends
- Ability to interact with data to gain greater insight
- Telling better stories
- Bringing your data to life
- Integrating data sources
- The dissemination of results – access your dashboards anywhere, anytime
- Dashboards provide an excellent branding opportunity
What Do We Do?
We are a survey and data delivery agency able to tailor a solution that fits your requirements.
We utilize class-leading software Dapresy which has been specifically designed for the market research industry (works directly on respondent level survey data). This coupled with our ability to create on-brand, bespoke dashboards to suit our clients’ requirements provides us with the tools needed to create a streamlined and functional solution for you.
Award Winning Solutions
Innovation is at the heart of everything we do, this being recognized by the Market Research Society. We are very proud to have won the highly coveted MRS Operations award (Best Solution) for three consecutive years (2015-2017). Our win in 2015 was for one of our dashboard solutions – the innovative Aer Lingus Voice of the Customer Solution.
If you are interested to find out how we can assist you with your dashboard requirements please don’t hesitate to get in touch.
