Actionable insights at your fingertips

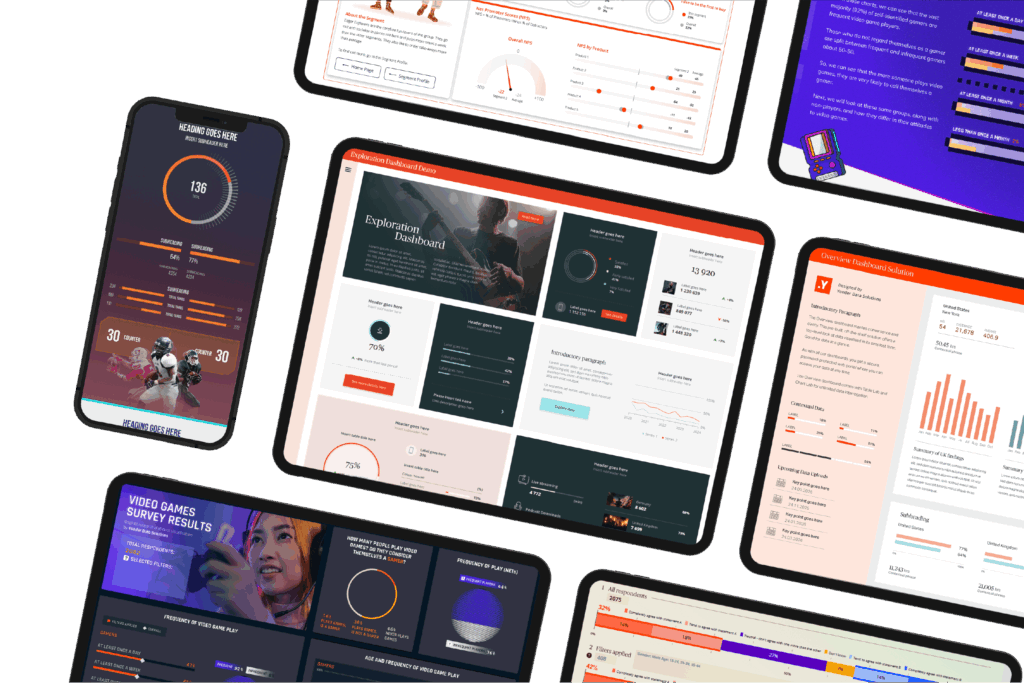
We transform your research data into dynamic, intuitive, and highly customised visual experiences, designed by expert visual designers to deliver instant clarity and empower intelligent decision-making.

A tailored range of dashboard products

Self-analysis
Empowering you with intuitive tools to interrogate data directly.

Overview
Provides a high-level summary for quick glances at key metrics.

Exploration
Integrates exclusive chart designs and bespoke imagery for deeper, engaging analysis.

Immersion
Fully custom-built for vibrant, eye-catching, and compelling visualisations.

Key use cases for our dashboards

Ad-hoc projects
For quick, project-specific insights.

Tracking studies
Dynamic monitoring of trends and KPIs over time.

Segmentation studies
Deep dives into audience segments with interactive profiles.

International projects
Easily compare and explore multi-country data.

Dashboard catalogues

Demographically representative sample of 1,000 London adults (18+)

Nationally representative online sample of 1,000 Scottish adults (18+)

Demographically representative sample of 1,000 Irish adults (18+)

500 respondents Director level or above in SMEs

The Yonder AI Summary Tool

Cutting-edge AI-powered insights

Revolutionise your open-ended responses. Our Al tool automatically summarises open responses in your survey and generates a concise and accurate summary in seconds. It analyses the general sentiments within all open responses and pulls out the top positive and negative themes.

Immersive dashboards

Here is some of our work that we feel pushes the boundaries of dashboard design.

NB Each button opens a dashboard in a new window.

Do we want more
nuclear power in the UK?

An interactive dashboard that takes you through the results of a Yonder study into the UK’s attitudes on building more nuclear power plants.

Women in Data: Women's health dashboard

Yonder partnered with Women in Data to create this dashboard that visualises research into women’s health conditions and experiences getting a diagnosis.

Gamers vs. non-gamers: Video Games Survey

Do people who play video games identify as a ‘gamer? Does this identification affect their attitudes to the medium of digital games?

Start a conversation

Our team combines deep experience with cutting-edge technology to provide the expertise you can depend on.

Prefer to use email? Get in touch at hello@yonderdatasolutions.com

This site is protected by reCAPTCHA and the Google
Privacy Policy and Terms of Service apply.