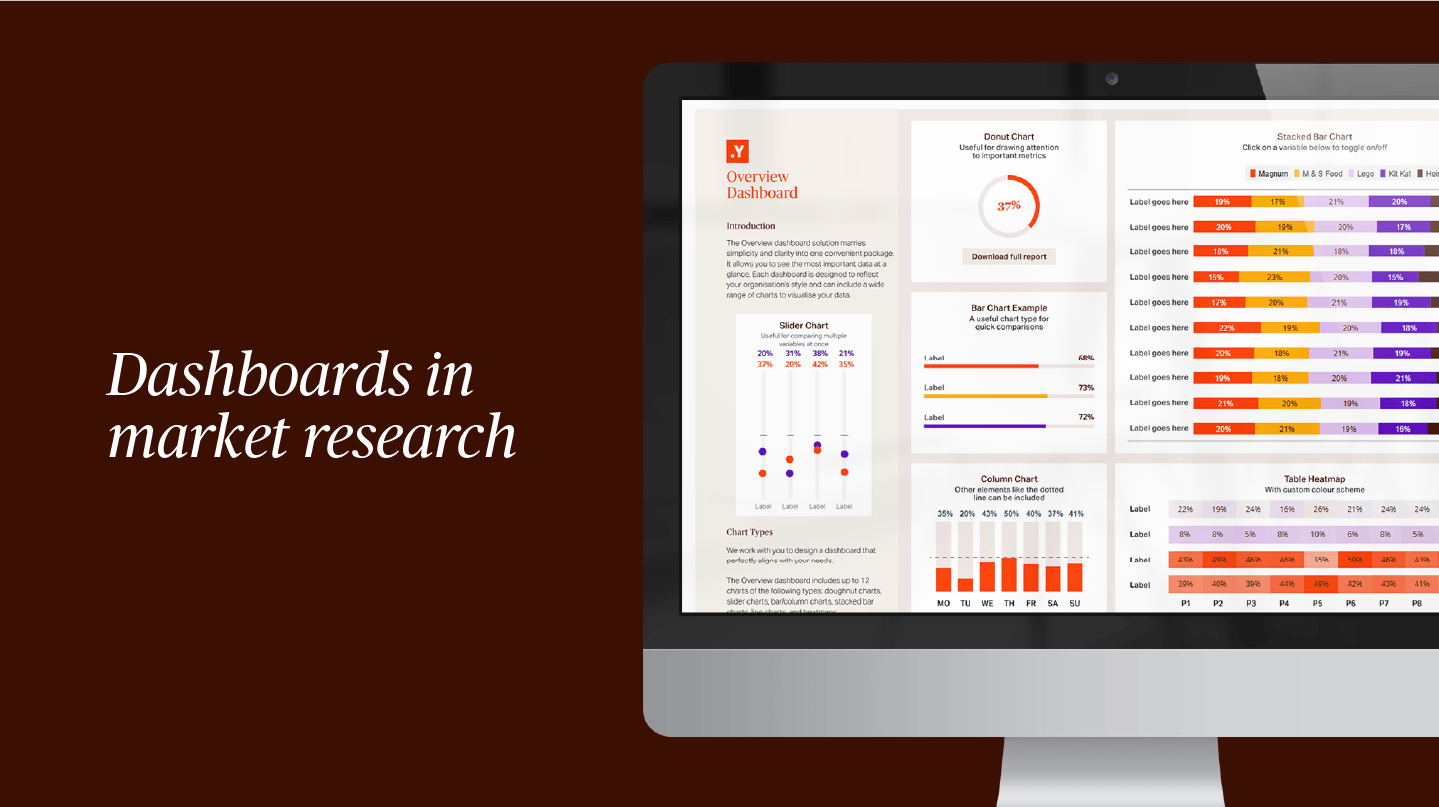
Market research dashboards are much more than static charts and infographics – they are powerful tools for developing your business’ strategy. In fact, there’s no limit to the kind of data or research results that can be visualised in a dashboard.
A segmentation study is just one type of research approach that can be used to create a dashboard. Segmentation dashboards combine and visualise all your consumer data in one place, allowing you to discover new insights about your audience and draw in-depth profiles of each consumer sub-group.
In this article, we’ll take you through the elements of a segmentation dashboard using our demos (also found here and here), and why it can be a powerful tool for your business.
 Disclaimer: All data shown in the demos are dummy data.
 What is a segmentation study?
A segmentation study involves collecting data from online surveys, focus groups, interviews and more to determine how your target audience can be split up into discrete sub-groups.
Each sub-group will have values, opinions, habits, and behaviours that set it apart from others and form its unique identity. Examples include a shared interest in ethical products, being tech-savvy, or using public transport every day.
Uncovering insights will help you fine-tune your marketing strategy and business model to speak to and serve your audience in a way that makes them feel seen and valued. Once you know who you are engaging, finding your biggest fans becomes that much easier.
Developing a segmentation dashboard
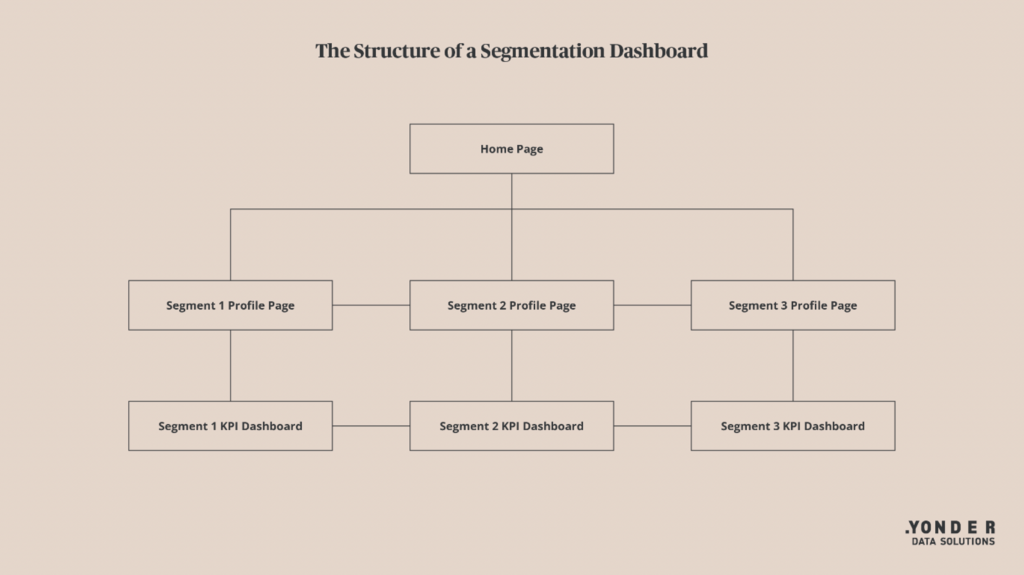
Identifying market segments is only half the battle. The other half is fleshing out these segments by giving them personality and telling their story so you gain insights from them. This process involves:
-
- Segment naming
- Visual design
- Writing
- Data visualisation
Bringing these elements together creates a set of assets that accurately reflects the essence of each segment identified by your segmentation study.
Segment naming
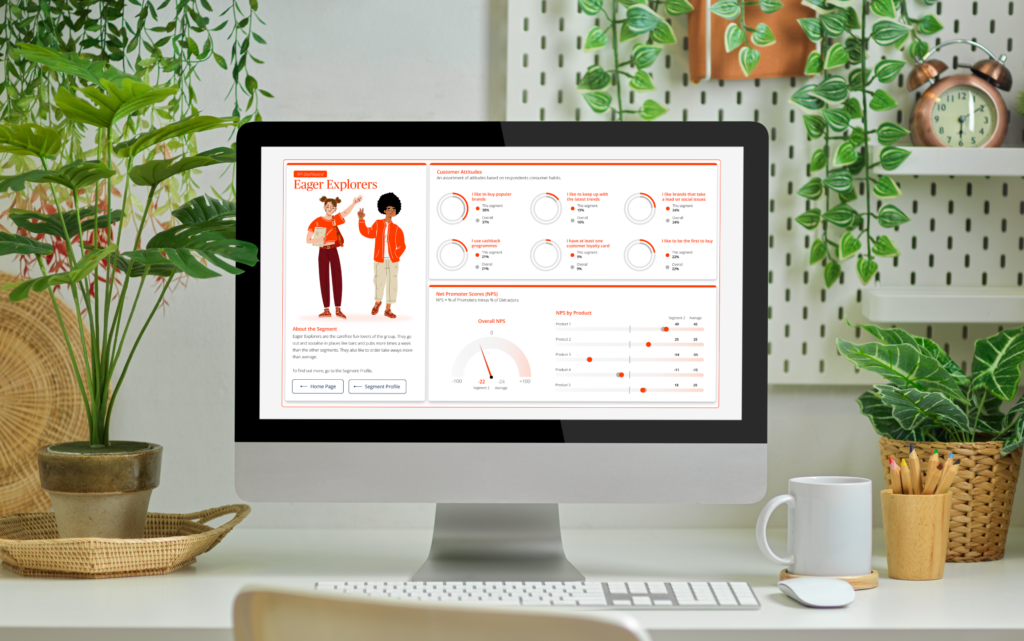
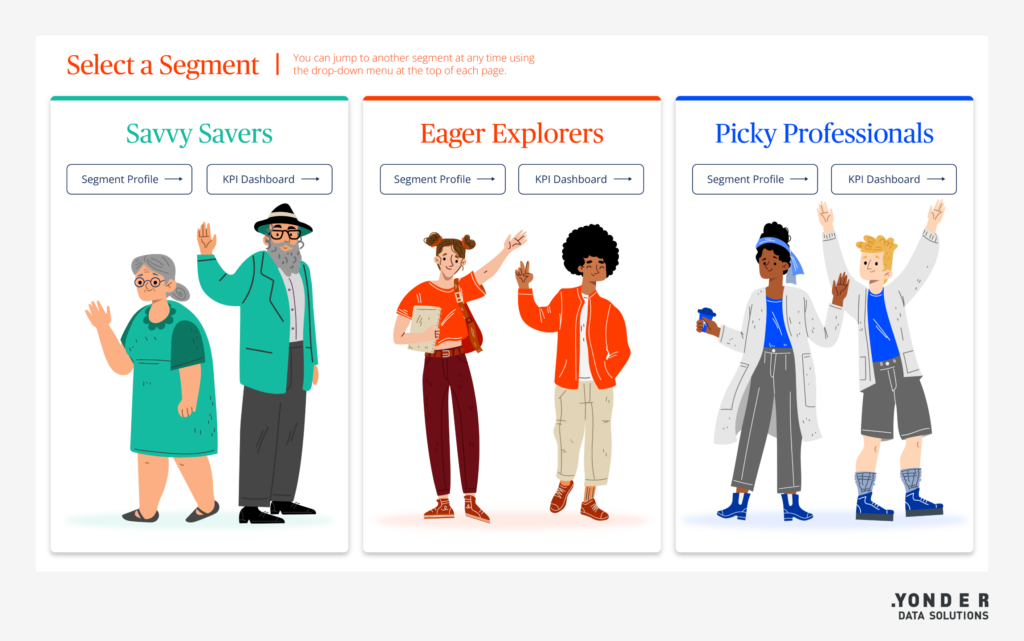 Segment naming can be a tricky aspect of segmentation. Too narrow and you risk your name being too niche. Too broad and you risk your name being too generalist. A segment name like ‘Savvy Savers’, ‘Eager Explorers’ or ‘Picky Professionals’ could be just right.
Visual design
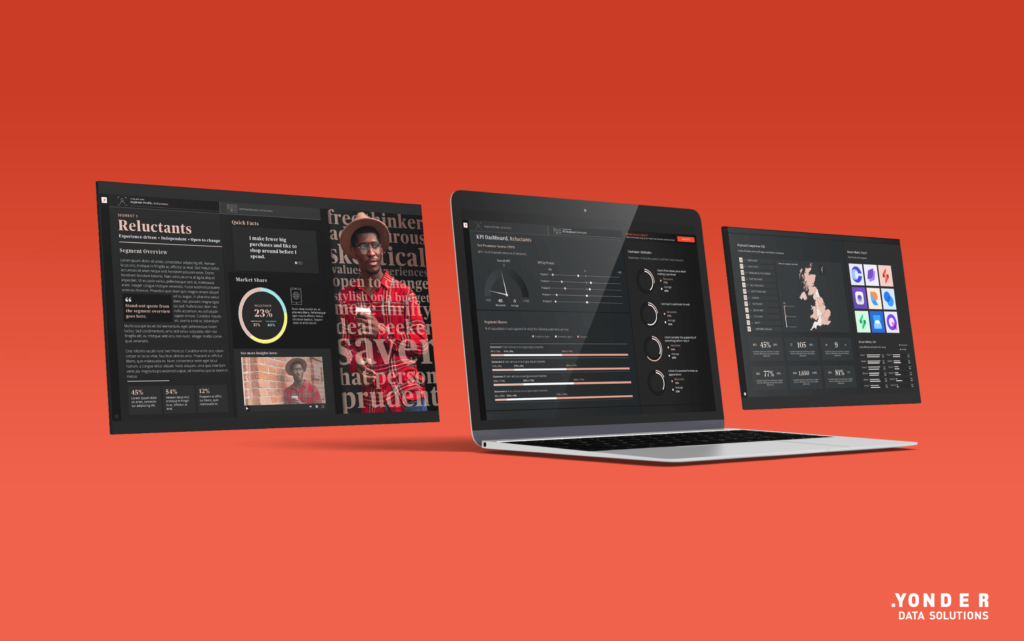
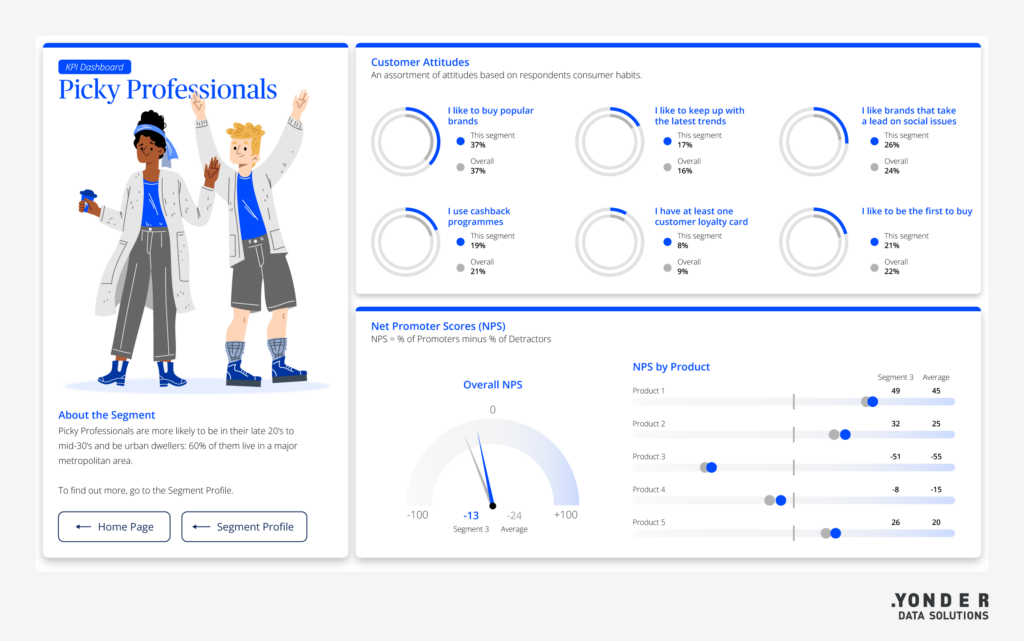 When you log in to your segmentation dashboard and select a segment, you are taken to its profile page showing key information about that segment. Illustrations and images help you to put context to your consumers’ data, solidifying your understanding of the segments. Not only that, the way in which the data is presented on the page makes it more digestible and easier for you to draw valuable insights.
To create a more visually engaging experience, we can combine a range of multimedia elements including:
-
- Video
- Audio
- Animation
- Photography
- Illustration
Descriptive writing
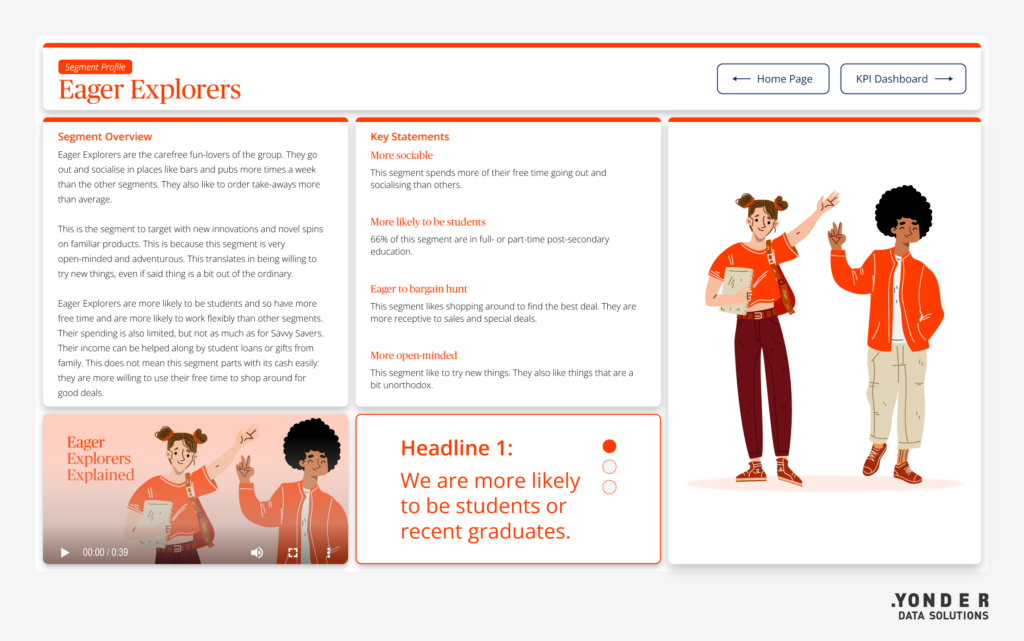 Here, you need to tell your consumers’ story. This part of the process enables you to paint a picture with words. Be descriptive, and that will help you to pull out key statements and conclusions that will identify who your biggest fans are, and in which segment they lie.
 Data visualisation
From the profile page, you can then move on to the dashboard page where a wide range of interactive charts present your data in a logical and useful manner. Each data visualisation is designed so you can instantly spot standout bits of information and easily compare data sets for each segment.
Basic charts like bar charts and line graphs are effective ways to visualise patterns in your data. Other less common chart types include an image grid that can, for example, show recognition and loyalty for a brand when the user hovers over its logo. Another popular chart type is a custom choropleth map (heatmap) that shows intensity of responses from different regions.
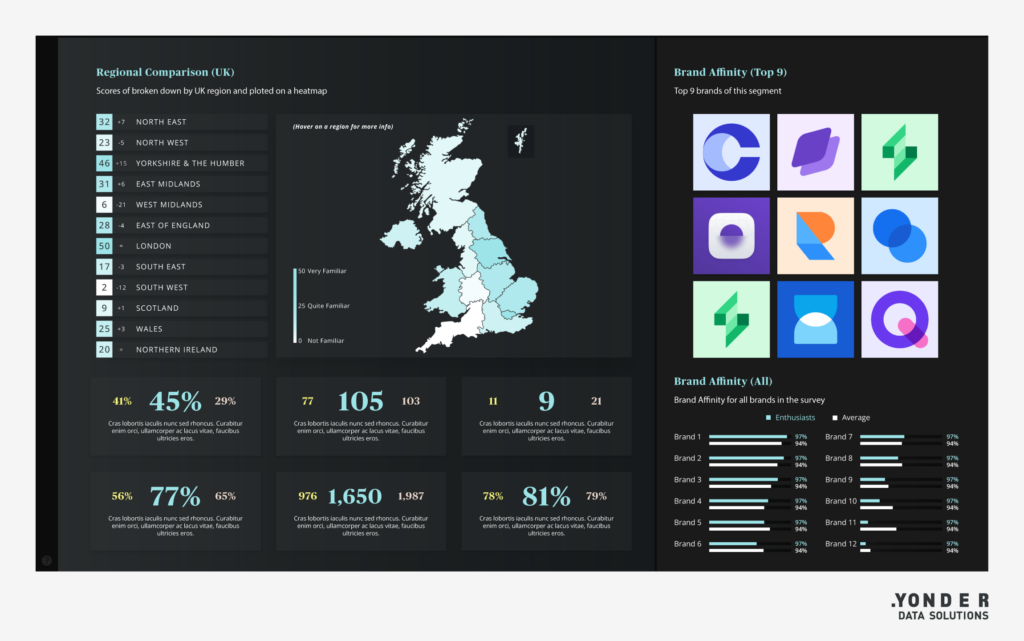 Segmentation dashboards can also visualise qualitative data. We can use quotes, word clouds, text extracts, and more to visualise insights gained from in-person interviews and open-ended survey questions.
 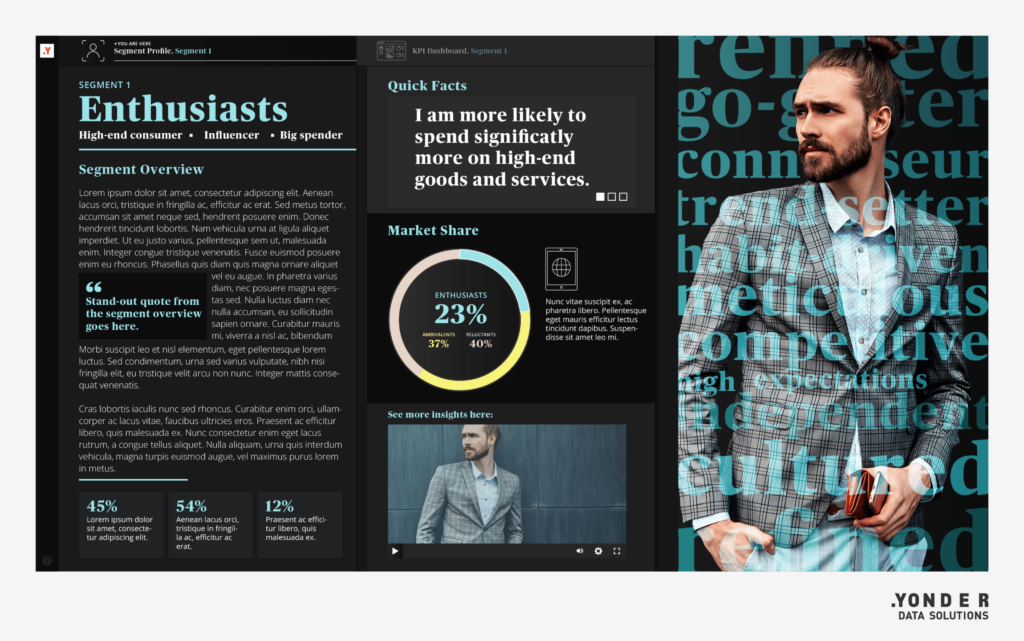 Putting all the above elements together harmoniously can elevate your segmentation dashboard into an impactful multimedia experience that accurately represents your customers. This resource will help you develop and communicate a business strategy that is built on your research data.
 What a segmentation dashboard can do for your business
A segmentation dashboard is not just a one-off presentation but an everyday resource that allows you to gain valuable insight into the mindset of your consumers. It converts your research from anonymous numbers on a spreadsheet to an engaging representation of your customers as the real people they are. It informs stakeholders at all levels of your business and helps with decision making, problem solving, and fosters a greater people-centric culture – ensuring every move your business makes is in line with the needs of your audience and your biggest fans. If you take the time and care to understand and cater to the needs of your audience, you will be rewarded with loyal fans who appreciate you going the extra mile to understand them.
Advantages of a segmentation dashboard include:
-
- Visualising who your audience is
- Having an on-hand reference of your audience’s key attributes
- Having a storytelling aid for presenting to stakeholders
- Instant comparison of survey results across segments
- The ability to update the dashboard with add-ons, additional survey data, and new segments
Segmentation dashboards from Yonder Data Solutions
We combine our dashboard offerings with our high-quality fieldwork and data collection solutions to provide a seamless way to bring research results to life and share them across stakeholders.
Want to see more? Head over to our dashboard page where you can see more demos and download our dashboard catalogue.
If you are interested in finding out how we can assist you with your dashboard requirements, please don’t hesitate to get in touch!